Learn more about some of my side projects!
Shiny
I love bringing data to life through interactive web applications! When Shiny was first introduced years ago, I knew that it would become indispensable in my toolkit. I spent a lot of time early on learning the basics and trying my best to understand reactive programming, all while being fairly new to the principles of web development. Over time, I grew much more comfortable with Shiny, learning more advanced topics while also strengthening my R programming skills, becoming more familiar with data visualization packages and improving my software development abilities. Check out some of the apps I have built, which are hosted on shinyapps.io:
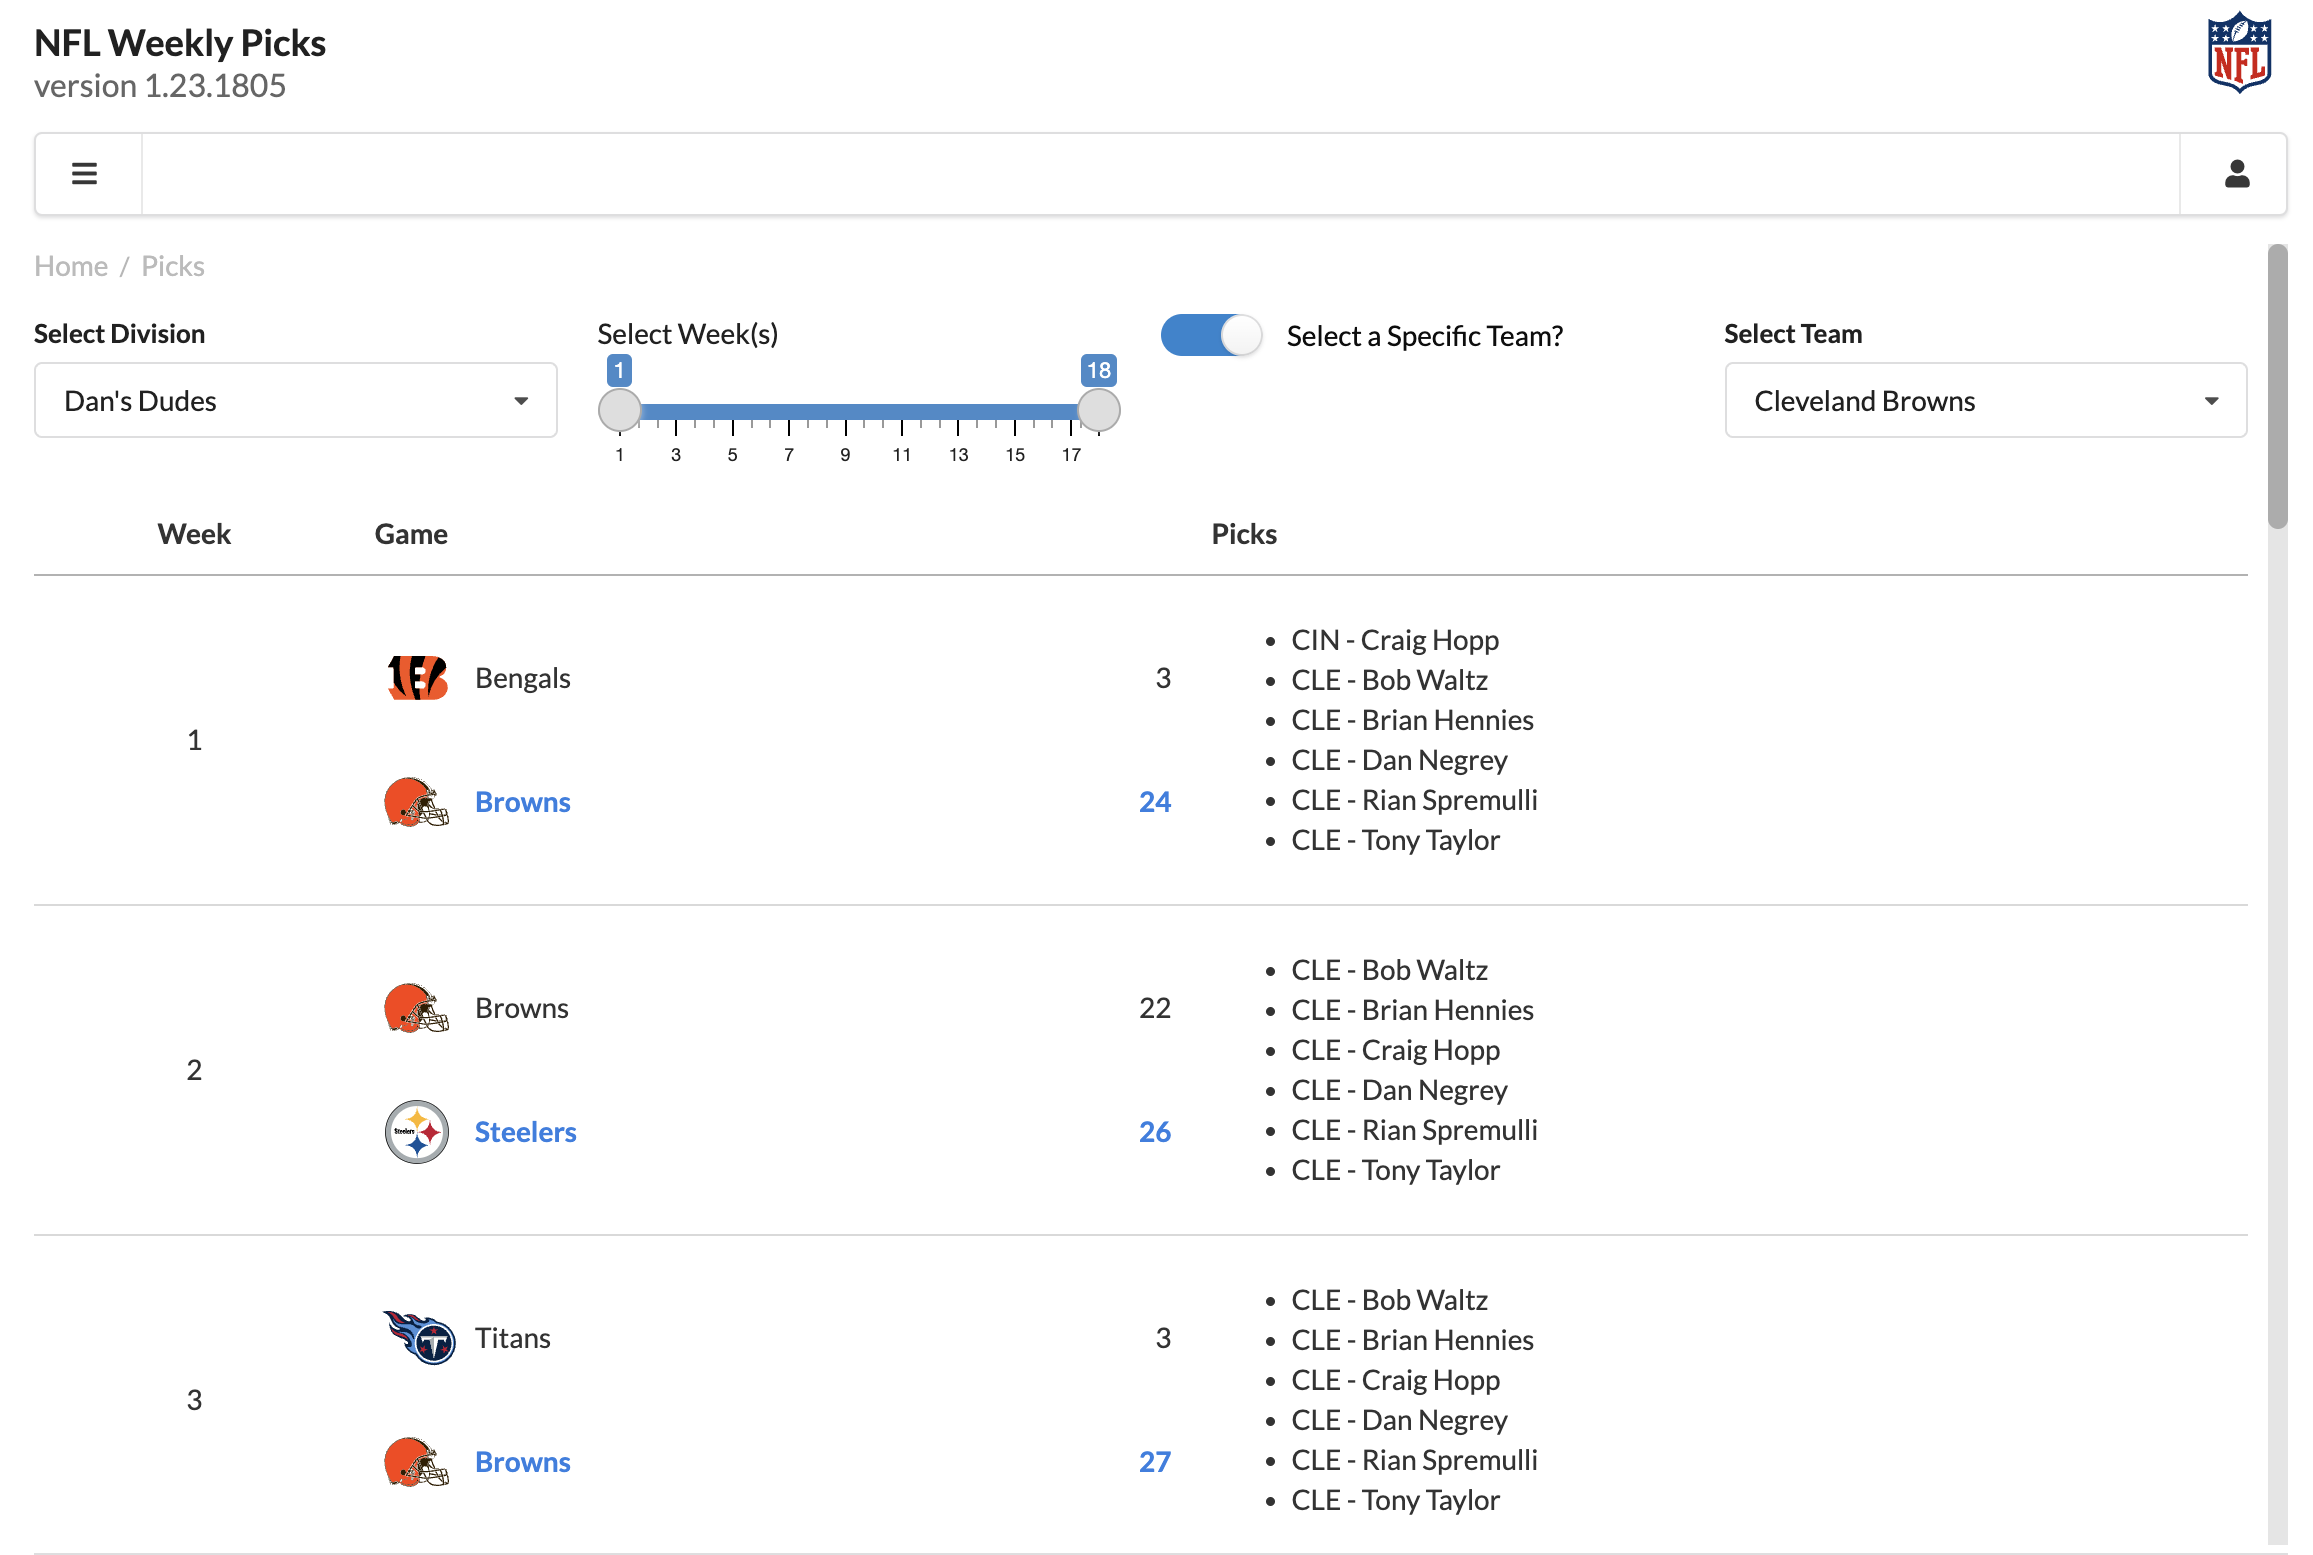
NFL Weekly Picks
In 2019, I built an app to track my family’s weekly picks for the NFL regular season. This app won me a spot on the System76 Superfan 3: Mission to Thelio (my proudest moment as an open-source data geek and an experience that I will never forget)! Be sure to check out System76 if you’re not already familiar - they are an awesome company, with great people, building amazing tech! It has been years since that contest and the weekly football picks continues to thrive, now including extended family and friends and a much better UI!
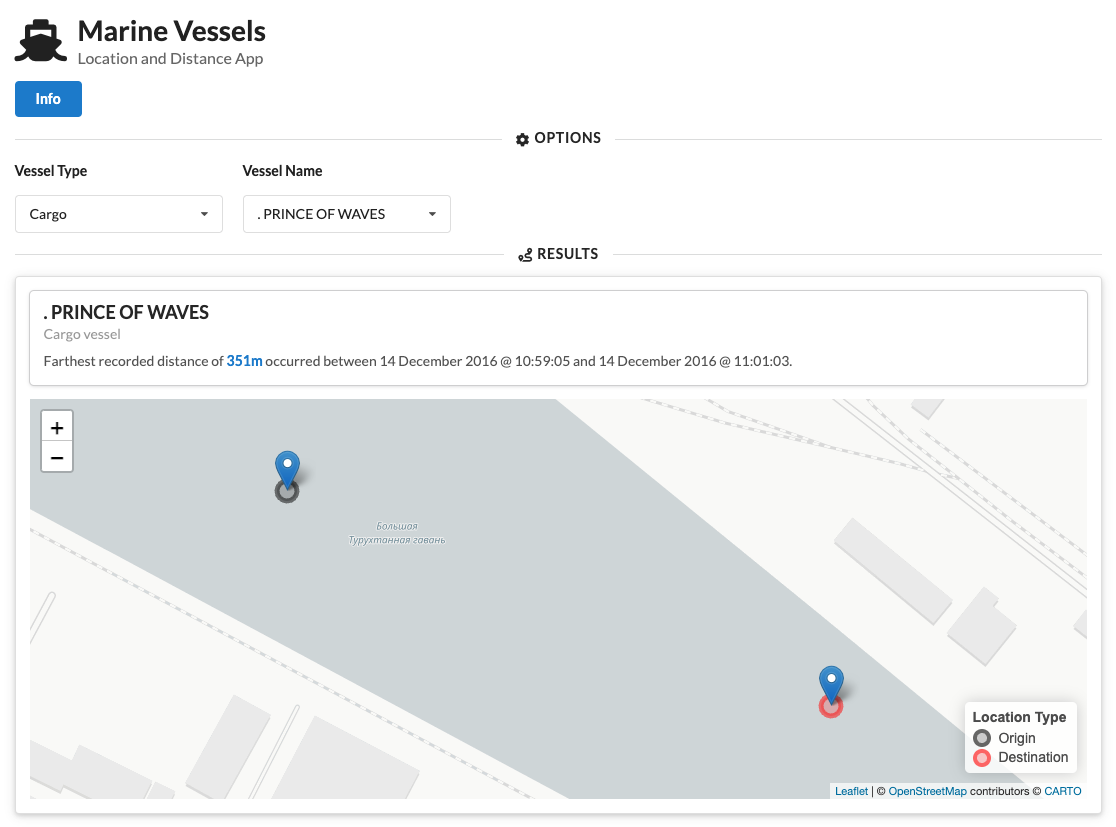
Marine Vessels
I have a lot of respect for the team at Appsilon, and the work they’ve done to advance the adoption of R and Shiny. A few years back I started exploring their shiny.semantic package and built the follow application which uses it to visualize data around marine vessel movement.
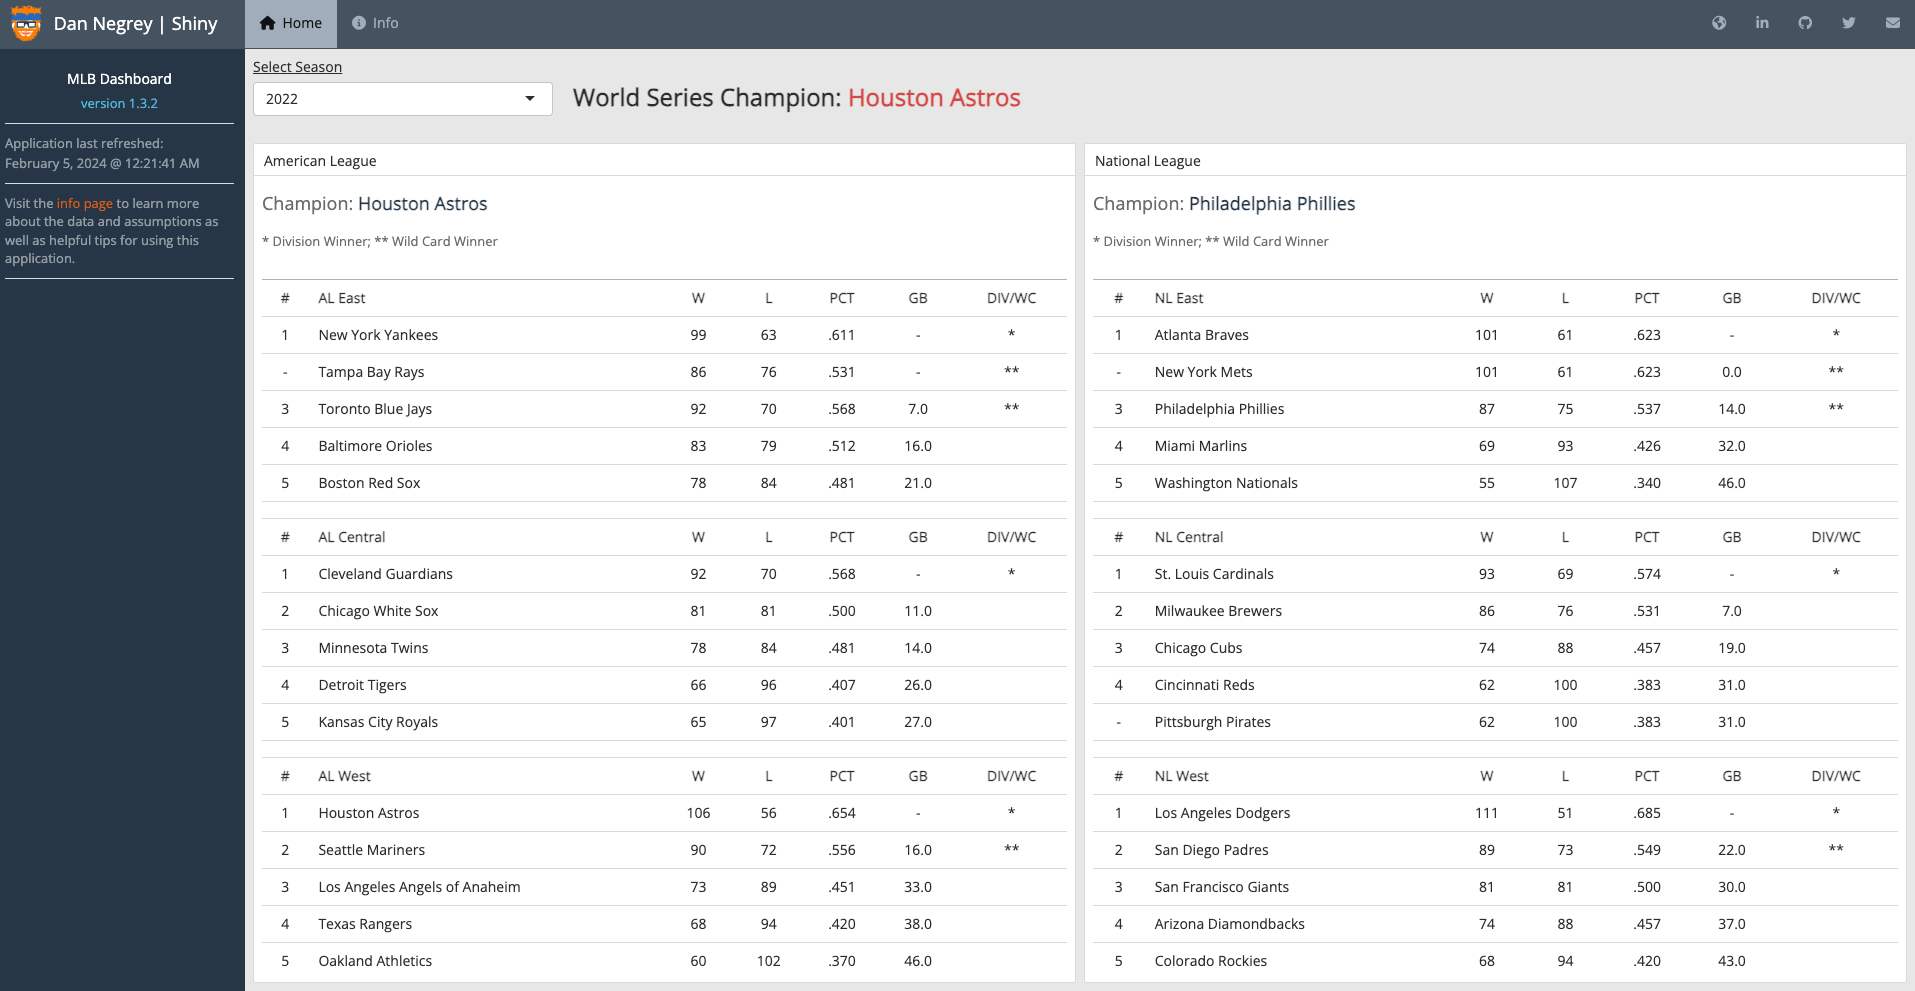
MLB Dashboard
Since it first came out, I’ve been a big fan of using flexdashboard for both static HTML output and with the Shiny run-time setting. Here is an example of the latter, leveraging data from the Lahman R package to show standings/results from every Major League Baseball season going back to 1903. Special thanks to Sean Lahman for creating such an amazing baseball database and making it open-source!
Professional development
I am an advocate for massive open online courses (MOOCs), and in particular, I have had great experiences with Coursera. Below are some of the courses I’ve taken and projects I’ve completed as part of those courses. This training was instrumental in helping me learn R, Shiny and the fundamentals of reproducible data science.
- Data Science Specialization offered by Johns Hopkins University
- Data Science at Scale Specialization offered by The University of Washington
- Data Manipulation at Scale: Systems and Algorithms (course)
Growth in the early part of my career was heavily dependent on learning the SAS programming language. Besides career advancement, though, I was very intrigued by making analytic processes more efficient - both in terms of reducing the time required for jobs to run as well as consolidating the code bases to be more concise. For each of these areas, mastering the SAS macro and SQL pass-through facilities was critical, and it started me down a path of data science software engineering that has persisted throughout my career and is a key component of my professional approach.
Some of the most eye-opening moments in my career have come while learning about paradigm shifting technology. Indeed, this was the case when I was first introduced to NoSQL databases like MongoDB and Neo4j. Each offers a community version of their product and a wealth of free training opportunities.
Other articles and presentations
I was very fortunate to be invited to speak at the inaugural Data Days Cleveland conference in 2017. Data Days CLE is the region’s only conference focused on accessible data and civic technology for community impact. I gave a presentation introducing R and spoke to attendees about how open-source data science tools like R have become critical for data accessibility and community impact.
You’re never too old to revisit the basics! This is an article I wrote back in 2015 that illustrates the fundamentals of using data distributions and summary statistics.


